High Memory Usage of LightArrayRevolverScheduler
Short Version
If your Akka-based application is using too much memory and your heap dump indicates that LightArrayRevolverScheduler is retaining a lot of heap, the reason may be that the code is calling system.scheduler.scheduleOnce(...) with an argument that references a lot of other objects.
Long Version
Akka-based application in Scala. Charts indicated that it used more memory than it should. Heap dump was taken and I analyzed it in Eclipse MAT. It said
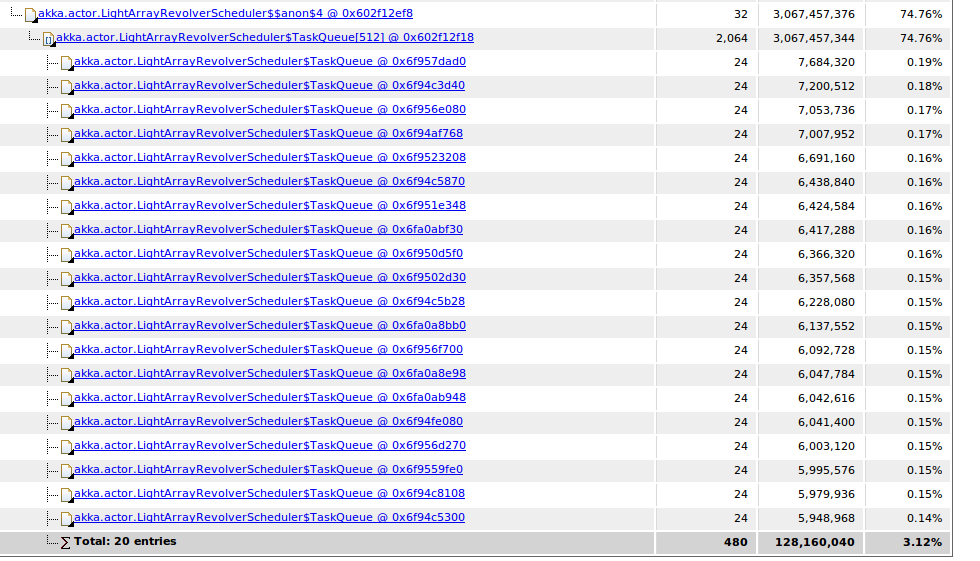
The thread java.lang.Thread @ 0x602f12cc8 [Redacted]-f5a7d860aaaf-scheduler-1 keeps local variables with total size 3,067,457,888 (74.76%) bytes. The memory is accumulated in one instance of “akka.actor.LightArrayRevolverScheduler$TaskQueue[]” loaded by “org.springframework.boot.loader.LaunchedURLClassLoader @ 0x60096f1e0”.
I tried to find something more but I couldn’t find any object created by the application itself. All I could see were Akka internals and the LightArrayRevolverScheduler queue that had 512 elements of similar size that summed up to almost 75% of heap space.
Google didn’t help much, all I found were Akka issues like this that were already resolved two years earlier. The application wasn’t getting killed with OutOfMemoryError so the task didn’t have high priority and was put on the back burner for some time.
Today I decided to investigate this issue a bit more. I read about LightArrayRevolverScheduler which is a component responsible for handling events that are scheduled to happen at some time in the future. It is a bit like Quartz, but aiming for shorter time frames and living inside the Akka ecosystem. LightArrayRevolverScheduler is used when the code calls methods like:
context.system.scheduler.scheduleOnce(duration, actorRef, message)
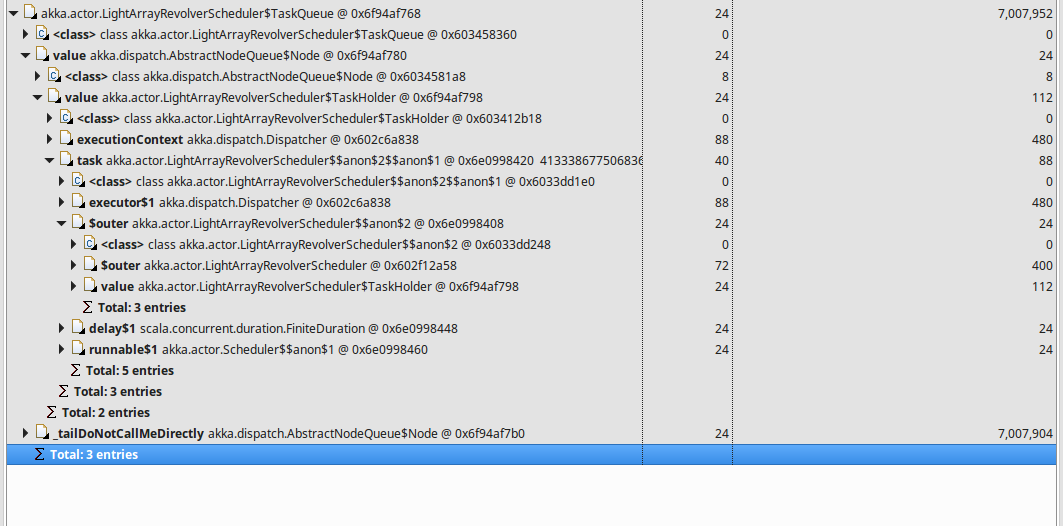
Seems quite innocent. I browsed through the usages and I didn’t find any message that could use so much memory. I decided to run some test cases with Intellij Idea debugger to see if it can show me something more than Eclipse MAT did. It turned out to have a quite nice memory browser that allowed me to find out what those TaskHolder objects actually had inside. The culprit turned out to be the $outer field of the message that was scheduled to be sent.
Most of the actors in that application were supposed to live less than a day. The purpose of the code responsible for this memory consumption was to make sure that actors are killed and deleted from the database after a few days if for some reason it doesn’t in the normal flow. So, a bit ironically, it was supposed to prevent memory leaks :-) The most important parts of it looked like this (the method was called by every actor just after it started)
trait ActorScheduledSelfDestruction {
  this: MyActor =>

  private case class SelfDestruct(actorStartTime: Instant) extends MyActorMessage

  private def selfDestructAfterDelay(timeToSelfDestruction: FiniteDuration, actorStartTime: Instant): Unit = {
    context.system.scheduler.scheduleOnce(timeToSelfDestruction, self, SelfDestruct(actorStartTime))
  }
}
Can you see what’s wrong?
So the issue is that the message case class SelfDestruct is defined inside the trait that is mixed into the actor class itself. Normally it should be defined outside of it, probably in a companion object. As an inner class, the SelfDestruct message has access to all the fields of the actor, which means that the whole actor instance cannot be garbage collected before the message instance is.
So the actor starts and calls scheduleOnce that is supposed to send SelfDestruct to that actor after a few days to kill it in case it is still alive at this point. Then the actor is cleaned up normally after a few hours. Unfortunately the task to send the message is still remembered by LightArrayRevolverScheduler and it references the actor instance in its closure, so the actor instance will not be garbage collected for a few days, even though it is not needed. The fix in this case was just to move the case class definition outside the trait.
Conclusion
- Even though in Scala creating classes is easy and they sometimes seem to be defined everywhere, the location of their definition is still important
- The First Rule of Programming: It’s Always Your Fault :-)